-
Who We Are
Overview
Sasol is a global chemicals and energy company. We harness our knowledge and expertise to integrate sophisticated technologies and processes into world-scale operating facilities. We safely and sustainably source, produce and market a range of high-quality products, creating value for stakeholders.
-
Our Businesses
Overview
Through proprietary technologies and processes the main products Sasol produces are fuel components, chemical components and co-products. From these main products and further value-adding processes we deliver diesel, petrol (gasoline), naphtha, kerosene (jet fuel), liquid petroleum gas (LPG), olefins, alcohols, polymers, solvents, surfactants, co-monomers, ammonia, methanol, crude tar acids, sulphur, illuminating paraffin, bitumen and fuel oil. Even further processing produces numerous additional products.
-
ESG
Overview
Advancing chemical and energy solutions that contribute to a thriving planet, society and enterprise.
-
Investor Centre
Overview
Sasol's investors consist of both equity investors (those invested in the Sasol ordinary shares or the ADRs) and lenders/debt investors (banks and institutional investors lending to Sasol or investing in its issues of debt instruments such as local bonds, offshore bonds, commercial paper issues, project finance, loans and other credit facilities and convertible instruments).
-
Suppliers
Overview
Supply Chain is the custodian of all external spend for the Sasol Group. It is responsible for managing supply and demand so as to ensure cost-efficiency and maximise return on spend, while at the same time ensuring effective logistics of a range of deliverables.
-
Careers
Overview
Explore existing opportunities to energise your career to the next level. Whether you are seeking a Learnership or you are Student or Graduate or Experienced Hire. Find out how you can add value to the Sasol Team.
-
Media Centre
Overview
Access media releases and view latest social media updates
Climate action as a strategic imperative

Climate action as a strategic imperative
Climate action as a strategic imperative
We are committed to our 2030 emission reduction targets and 2050 net zero ambition, launched in 2021, with clear targets to reduce Scope 1, 2, and 3 (Category 11) emissions by 2030. Our optimised Emission Reduction Roadmap (ERR) charts the path forward, balancing decarbonisation with long-term value creation, enterprise resilience, and inclusive growth. We are also advancing value creation, aligned with our fair share responsibility within South Africa’s national context.
Let's have a look at our performance this year.

To support robust strategy development, Sasol conducts scenario analysis based on globally recognised pathways, including the International Energy Agency (IEA) Net Zero Emissions scenario and the Intergovernmental Panel on Climate Change (IPCC’s) climate models. These help us evaluate how different climate futures, across varying regulatory, technological, and market conditions, could affect our business. Scenario insights have informed the design of our optimised ERR, which ensures compliance while improving returns, accelerating renewable energy investment, and leveraging carbon offsets. Our roadmap is resilient and adaptable, designed to deliver a 30% reduction in scope 1 and 2 GHG emissions by 2030.
Resilience of the portfolio | Scenario updates
We update our global and South African scenarios annually to inform internal strategy processes and decision- making. We leverage national and international scenario databases to create and review a balanced but challenging set of global and South African scenarios annually to inform internal strategy processes and decision-making. International references include: Including the International Energy Agency (IEA), South African Petroleum Industry Association (SAPIA), Shell, bp, Oxford Economics, World Energy Council, S&P Global, Wood Mackenzie, Rystad, International Air Transport Association (IATA), the International Council for Clean Transport (ICCT), BloombergNEF, World Economic Forum (WEF), International Monetary Fund (IMF), World Wide Fund for Nature (WWF), the World Bank and Statistics South Africa (StatsSA).
Updates to our scenarios focused on revisions to the short to medium term globally and locally. Global economic outlook has been updated to reflect recent short- to medium term developments, potential trade or tariff wars, geopolitical uncertainties, investment, productivity dynamics and revised data.
It should be noted that scenarios are not predictions or forecasts, but rather tools to assist in managing Sasol’s responses to future uncertainty.
Scenarios are hypotheses of the future, informed by data from various sources, constructed using models and contain insights from experts in relevant fields. All scenarios should preferably be read together as representing a complete picture of the future, told along different storylines. It is unlikely that a single scenario will materialise on its own.
- Temp range: 2°C – 3°C
- Updates include the changes to the trade landscape – which will be longer lasting and impacting inflation, logistics costs, GDP
- Continued uneven regional economic recovery post COVID; economic challenges disproportionately distributed across globe
- Geopolitical tensions in certain areas create increased uncertainty, changing trade relationships, challenged supply chains, increased costs and volatility of prices
- Some cooperation on technology, funding, investments
- Global oil and liquids demand peaks at around 108 mbpa in the mid 2030s
- Global petrochemical demand increases. Recycling & reuse of plastics improves
- Global liquids demand for transport peaks in early 2030s
- Despite challenges with grid infrastructure roll out electricity demand increases. Natural gas begins to replace coal in the power sector in developing countries. Renewables show improved price competitiveness over gas and are more widely adopted in developed economies. Affordability and access to infrastructure remain key.
- Greater investments are required in adaptation efforts, which are projected to increase over time.
- Temp range: >3°C
- Updated and restructured trade landscape – higher tariffs, increased conflicts & tensions - resulting heightened uncertainty result in a more fragmented global economy, trade landscape and relationships
- Initial global GDP impact which then recovers to trend post 2030
- Many countries focussed on energy, supply chain security, self-sufficiency, nationalism
- New trade partnerships increase costs of key minerals, metals; reduced access to technology, funding & investment, affect affordability & progress.
- Longer timeline & less pressure on emission reduction targets; lower efficiency
- Global oil and liquids demand peaks at around 112 mbpa in the mid 2030s
- Petrochem demand continues to rise. Slower technology development hampers demand reduction in developing regions.
- Global liquids demand peaks & plateaus in the 2030s, with jet fuel still growing up to 2040.
- Finance is not easily accessible due to changing requirements and geopolitical alliances.
- Adaptation requirements and costs are significant, related to more frequent and extreme weather events for both developed and developing countries.
- Temp range: 1.5°C – 2°C
- Many countries cooperate on technology availability & accessibility
- Energy efficiency gains, behaviour & life-style changes, strong legislation, policy, political commitment; high cost of compliance, strong recycling & circular economy developments improve plastic consumption
- Price volatility/ uncertainty can be expected a traditional feedstock supply declines but demand growth continues
- Global oil and liquids demand peaks in the late 2020s at around 106 mbpd driven by more new technology vehicles, charging infrastructure, engine efficiency, modal shifts and behaviour changes. Affordability is spurred by technology sharing and subsidies. Oil-derived jet fuel demand
- Demand increase for petrochemicals is dampened by behaviour and lifestyle changes, recycling and circular- economy developments. Strong cooperation helps to close the gap left by lower fossil-based feedstocks.
- Many countries are investing in mitigation efforts; but some climate change adaptation efforts are required, especially in developing countries.
- Temp range: ~1.5°C
- An aspirational scenario, built to achieve a NZ by 2050
- Full global cooperation assisted by strong penalties & legislation
- Significant price volatility along with challenges to obtain critical resource minerals for new technology
- Global oil and liquids demand peaks at around 106 mbpdd in the late 2020s, assisted by a high penetration of electric, hybrid and fuel-cell vehicles with the required charging infrastructure. Fossil jet fuel demand is reduced by SAF, operational efficiency improvements, behaviour change and modal transport shifts.
- Petrochemical demand increases as population and middle class grow. Demand is dampened by strong recycling and circular economy options. The challenge is access to alternate green feedstock as traditional fossil derived feedstock decreases significantly.
- There are fewer climate change adaptation requirements.
Resilience of the portfolio | Signposts
- South African carbon regulation including carbon tax recycling and carbon budget
- Regulatory and policy changes including RED II, flexible allocation, carbon border tax design
- Geopolitical indicators
- Macroeconomic drivers such as oil price, rand/dollar exchange rate, inflation, economic growth, product prices, feedstock price
- Sustainability obligation and associated costs of investment required
- Partnering and relationship trends and requirements
- The pace of technology development
- Financing and funding trends and requirements
Quantitative robustness testing of our strategy
Scenarios are used to test the robustness of our strategy, both qualitatively and quantitatively, to assist in identifying potential risks and opportunities as well as to improve overall strategic resilience. The result of the robustness testing assists in shaping the Sasol of the future strategy and in identifying possible risks to the strategy. Sasol is actively monitoring opportunities for further value creation into the future. Some interventions currently being progressed include:
- Improved feedstock resilience
- We continue to explore opportunities to lower our exposure while balancing production and decarbonisation, incorporating lower carbon feedstocks like biomass.
- New value chains
- We are exploring renewable power, gas-to power, green hydrogen, sustainable carbon sourcing, sustainable aviation fuel and other growth areas, focusing on those with attractive returns before 2030 and that support local job creation.
- Chemicals growth
- Our chemical products enhance lightweighting, energy efficiency, packaging, personal care, homecare, industrial and institutional cleaning, industrial applications, and alumina materials for specialty applications. We continue to monitor carbon border tax impacts on our chemicals portfolio.
- Climate change impacts
- We monitor potential climate change impacts, including production loss, supply chain interruptions and infrastructure damage. Climate resilience and adaptation to weather impacts is a key design philosophy.
Quantitative robustness testing to FY30
Testing process:
- Price assumptions are developed for each product and feedstock in each scenario, including oil, refined products, natural gas, chemicals and US ethane.
- These price assumptions as well as the outcome of the financial modelling are signed off by the Sasol Group Assumptions Committee.
- Through Group Finance, a detailed financial modelling exercise is undertaken to test the financial robustness to FY30.
- We used the metric of Earnings Before Interest, Taxes, Depreciation and Amortisation (EBITDA).
- Outcomes of the modelling are also signed off by the Assumptions Committee and used for decision-making.
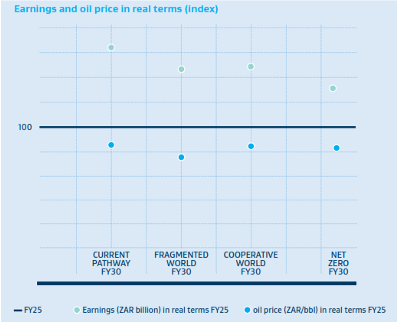
In the graph, the dotted line indicates the indexed FY25 EBITDA in the Current Pathway. This is compared to the indexed values in the scenarios in FY30. The comparison in the different scenarios is dependent on the relative oil price and feedstock cost variations. Despite varying scenarios, we employ an agile process that proactively adjusts and shapes our strategy, enhancing our resilience by capitalising on new, sustainable growth opportunities.
Outcome of qualitative robustness test
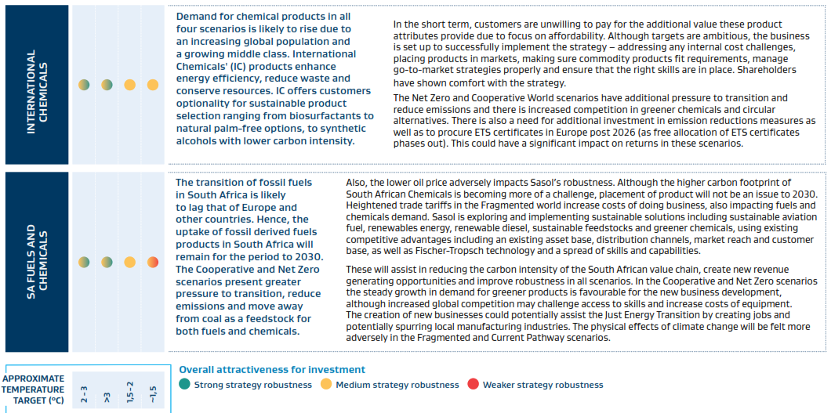
- Sasol is progressing the GHG Emission Reduction Roadmap towards a 30% reduction target by 2030 by adopting new sustainable energy and feedstock opportunities, improving energy efficiency and incubating and scaling new sustainable opportunities to grow new value chains. Many of these activities like renewable diesel, renewable energy and bio-based feedstocks, are housed in our Business Building initiative. The effect of these new lower carbon opportunities will be felt across Sasol both in South Africa and internationally.
- Here we use a grading system to evaluate different elements of our Sasol of the future strategy up to 2030 by inviting a multi-disciplinary team from different parts of the company to evaluate the robustness of the strategy along different themes in each of the four scenarios. These themes include:
- Possible stakeholder (shareholders, non-governmental organisations and government) response to proposed strategy;
- Strategy dependency on policy and regulatory changes;
- Fluctuations in demand for liquid fuels and chemicals;
- Market and competitive changes for liquid fuels and chemicals; and
- The executability of the strategy (eg operating model, partnerships, capabilities, skills availability and the financial framework).